Macro trend analysis via altcoin correlations.
How changes in the spread of altcoin correlations to bitcoin and ether can be used to model market sentiment and risk preferences.
Estimated reading time: 5 minutes.
Cryptocurrencies are highly correlated risk-on assets. Each token has a specific strength from which it derives some of its value, but with significant fiat flowing into the asset class, low supply availability, and an impossible challenge of how to value individual tokens, monetary inflows become distributed across all cryptocurrencies. The blind flow of money into valuable and valueless protocols reinforces the high correlations in the space, injecting noise and attenuating signal. But is there information in the noise itself?
Examining multiple correlations across the space, we can filter the noise of individual tokens to look back at historic events to see industry wide compressions (e.g.: the liquidity crisis brought on by the Coronavirus outbreak in early-2020, or China’s ban on cryptocurrencies in mid-2021). These compressions tend to be reactive and non-predictive1, but we can extend the analysis by looking at the change in the spread of the average correlation to bitcoin to the average correlation to ether, and decipher whether the macro backdrop is moving in a risk-on or a risk-off direction.
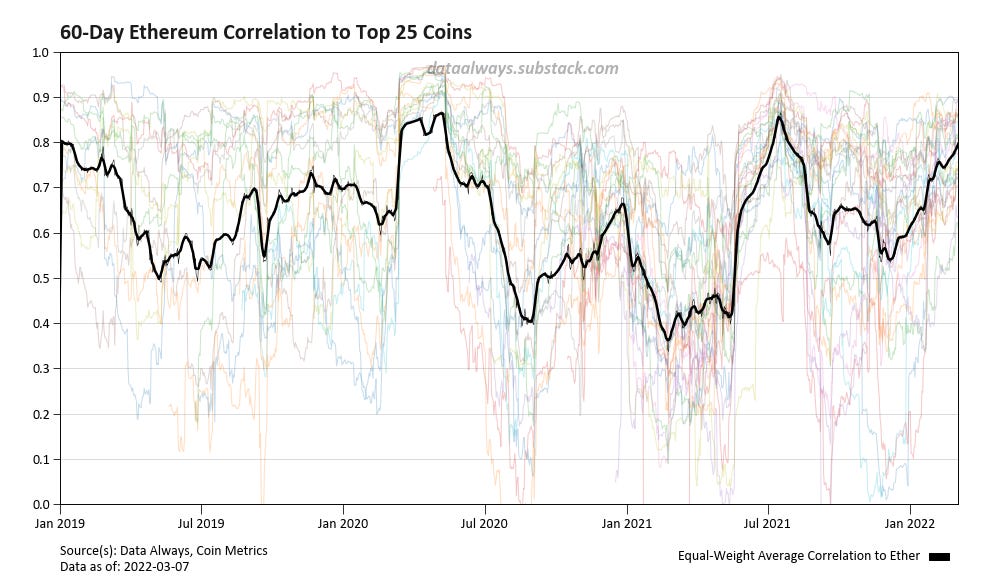
The chart above is repeated in the footnotes for correlations to ether2.
As highly correlated assets, we should expect the pair of parametrically defined correlation time series to follow closely (the two time series being the equal-weight average correlations to bitcoin and ether). We see in the figure below that generally they do, but the behavior of interest is when they don’t. Instead of looking at the absolute change in correlations we will consider the widening and tightening of the difference between the correlation functions.
Now taking the difference between the two correlations we find a profile for how the spread evolves in time. Although still noisy, a pattern emerges showing that while the spread between correlations is expanding the market tends to be in a risk-on environment—applying positive pressure to the price of all cryptocurrencies.
Similarly, as the spread compresses, we take this as a sign of a risk-off move which will usually lead to large corrections across all tokens. It is important to note that these compressions tend to occur while industry-wide correlations to ether are rising, but as they have a higher baseline than bitcoin, we see a faster rise with bitcoin and thus a compression in the spread. We must combine the two correlation profiles in order to extract forward looking information about changes in the risk profile of the asset class.
We also note that because bitcoin and ether remain highly correlated assets (with correlations tending to be in the 0.6 to 0.9 range), there are some fairly strict bounds in the spread. A spread that widens into the range of 0.2 is a sign of extreme risk-on behavior, while any inversion should be taken as a signal that fear is driving the market.
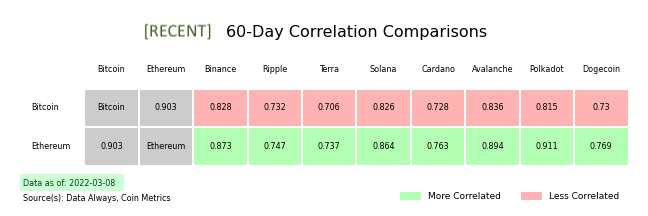
If we dive into the individual data and look at the current top ten non-stablecoins by market cap, we see that all of their recent correlations to ether are higher than they are to bitcoin. This makes sense because they’re all closer on the risk curve, to ether than to bitcoin.
By contrast, if we jump back in time to early-May 2021, right before the Chinese Mining ban, but also as many on-chain metrics started to show a breakdown in the bullishness of the space, we see that as the correlation spread compressed most of the large coins in the space had their correlations inverted.
The following is my take on why inversions are interesting, but it is speculative and needs more exploration.
If we think of correlations to bitcoin as a market-wide force or wave that drives forward the price of all cryptoassets, then, after adjusting for the cross-correlation, their correlation to ether’s non-bitcoin properties becomes negative.
For those of us who see Ethereum as the main driver of blockchain technological innovation (as opposed to the recent consensus desire for Bitcoin to never change), these inversions suggest that the parallel innovations behind other major cryptocurrencies become short-term worthless—demonstrating that the value they offer is orthogonal to the value that Ethereum brings to the ecosystem.
If the value propositions are largely orthogonal it reinforces the opinion that Ethereum does not have any significant direct competitors.
I think people who tend to focus solely on bitcoin or solely on ethereum throw away valuable macro information. Although cryptocurrency price action has been corrective since early November, largely driven by traditional market de-risking in the face of high inflation and the short-term ending of QE, a lot of the underlying dynamics in the cryptocurrency space still appear promising.
I’m hopeful that the once again rising spread discussed here remains a reliable indicator3. If I were to make a judgement, I would suggest that the current state of dual-rising correlations seems more reminiscent of July 2021 than March 2020, suggesting that we’re more likely on the cusp of a move upwards than another leg down.
- T.
I’m curious as to whether the size of the compression could be used to model the severity of a risk-off move, but I think we need more data than the scope of this analysis. Perhaps it’s a more interesting experiment to look at band compressions for all the companies in the S&P 500 vs the index itself and then model the change in variance to try to gauge how serious a financial event is.
I think it would be another interesting experiment to extend this analysis further and further into the risk-curve to look at whether we see a continually expanding spread.


